How Indicators Work
An acid-base indicator is actually a Weak Acid itself (
The equilibrium equation is:
The Mechanism (Le Chatelier’s Principle)
- In Acidic Solution (High
) - The concentration of
pushes the equilibrium to the LEFT. - The solution takes the colour of the weak acid (
).
- The concentration of
- In Alkaline Solution (Low
) - The
from the alkaline solution reacts with the , lowering its concentration. - The equilibrium shifts to the RIGHT to replace the
. - The solution takes the colour of the conjugate base (
).
- The
The pH Range of an Indicator
- Indicators do not change colour instantly at pH 7.
- They change colour over a specific pH Range, typically spanning about 2 pH units.
The pH at which the colour change occurs depends on the
| Indicator | Acid Colour | Base Colour | pH Range | Use Case |
|---|---|---|---|---|
| Methyl Orange | Red | Yellow | 3.1 - 4.4 | Strong Acid titrations |
| Phenolphthalein | Colourless | Pink | 8.3 - 10.0 | Strong Alkali titrations |
The Math: Why pH ≈ pKin?
The midpoint of an indicator’s color change occurs when the concentration of the Acid form (
) equals the Base form ( ). Using the equilibrium expression:
If
, they cancel out: Taking negative logs of both sides gives the rule:
This explains why different indicators work at different pH levels—it depends entirely on their specific
value.
Selecting the Correct Indicator
To get an accurate result, the indicator must change colour during the vertical section of the titration curve.
The Rule: The pH Range of the indicator must fall completely within the Vertical Section of the titration graph.
Matching Indicators to titrations
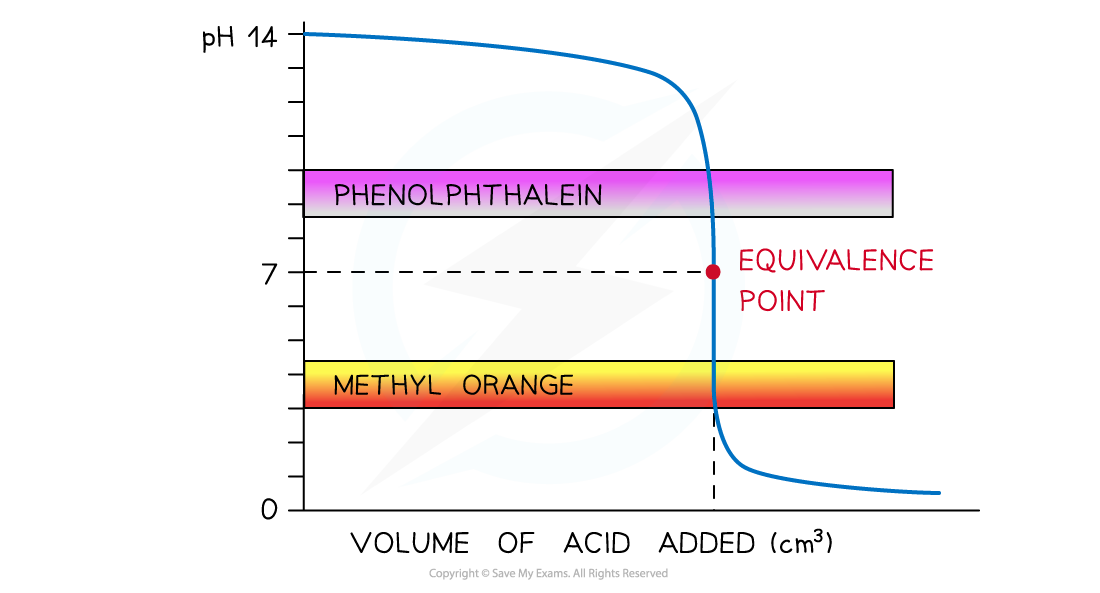
Strong Acid + Strong Alkali
Suitable Indicator: Both
pH curve of strong acid + strong alkali titration
- Vertical Section: pH 3
10 - Suitable Indicator: Both
- Explanation: Both ranges (3.1-4.4 and 8.3-10.0) fall inside the huge vertical jump.
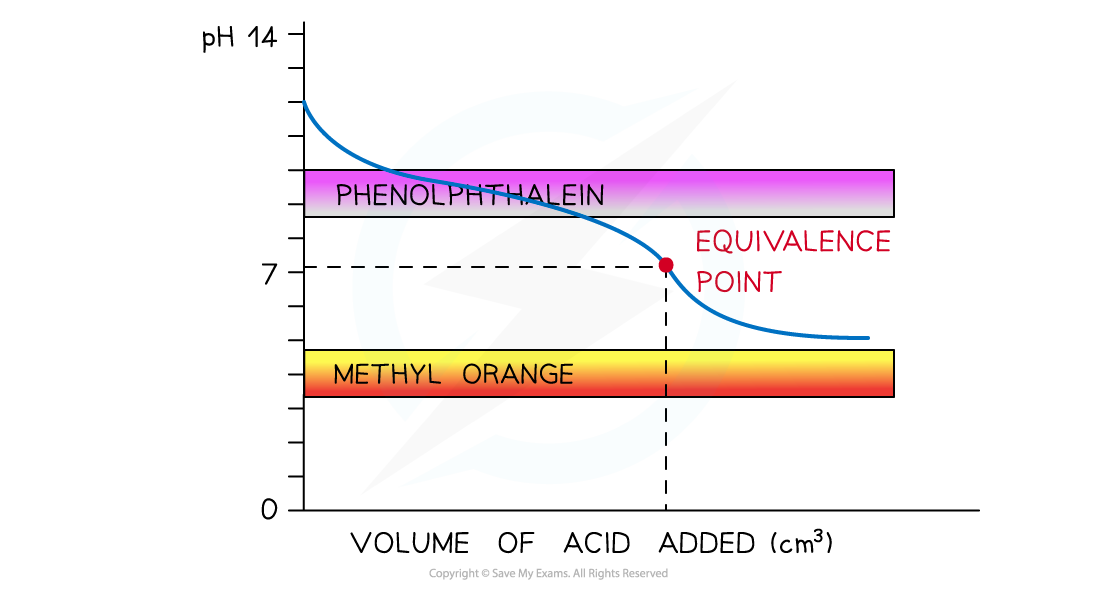
Weak Acid + Strong Alkali
Suitable Indicator: Phenolphthalein
pH curve of weak acid + strong alkali titration
- Vertical Section: pH 7
10 - Suitable Indicator: Phenolphthalein
- Explanation: Vertical section is high. Methyl Orange (3.1-4.4) would change too early.
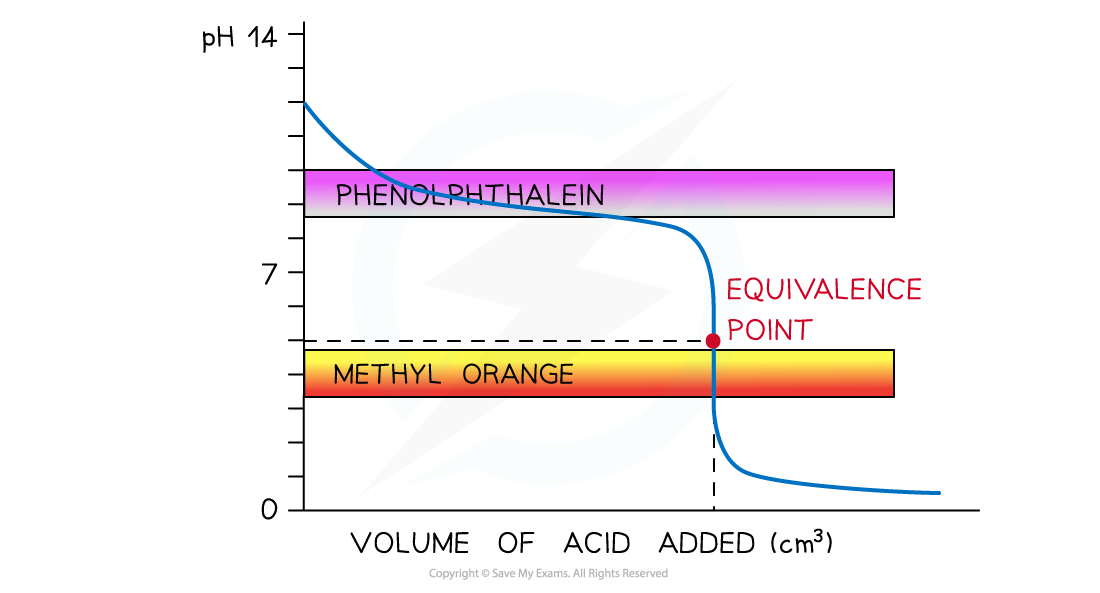
Strong Acid + Weak Alkali
Suitable Indicator: Methyl Orange
pH curve of strong acid + weak alkali titration
- Vertical Section: pH 3
7 - Suitable Indicator: Methyl Orange
- Explanation: Vertical section is low. Phenolphthalein (8.3-10.0) would change too late.
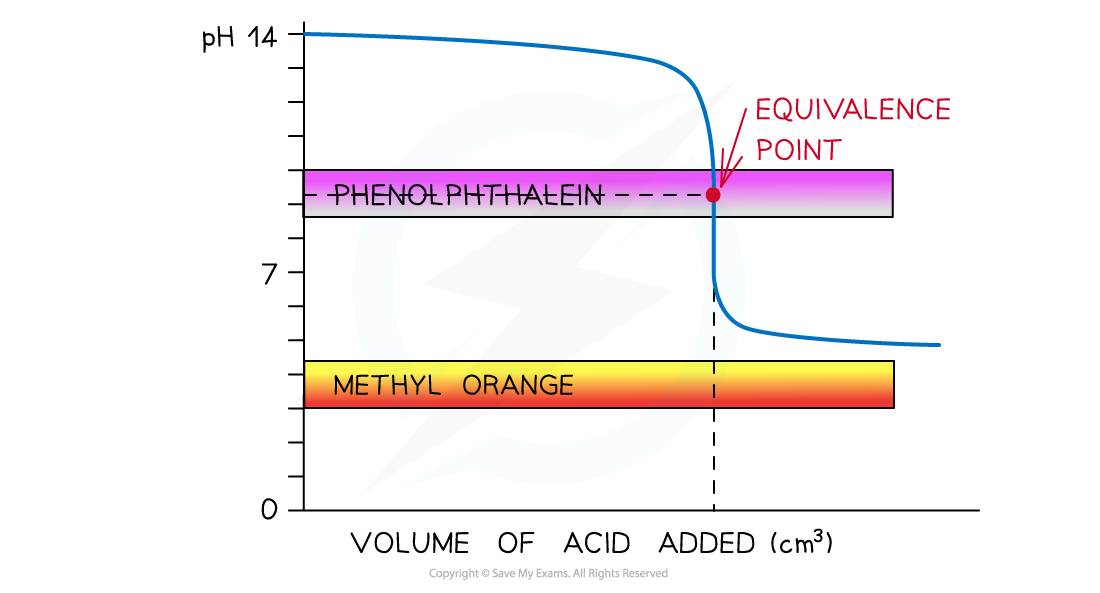
Weak Acid + Weak Alkali
Suitable Indicator: None
pH curve of weak acid + weak alkali titration
- Vertical Section: None
- Suitable Indicator: None
- Explanation: There is no vertical section. No indicator gives a sharp endpoint.
Note: A pH meter can be used instead