Anatomy of a pH Curve
A titration curve plots pH (y-axis) against Volume of Titrant Added (x-axis). The Shape tells us three things:
- Initial pH: Indicates the strength of the acid or alkali in the flask.
- Equivalence Point: The precise volume where moles of acid = moles of base.
- Vertical Section: The steep jump in pH. This determines which indicator can be used.
- Final pH: Indicates the strength of excess alkali or acid.
Context
The examples below assume you are starting with
of Acid in the flask and adding Alkali from a burette. If you reverse the setup (Alkali in flask), the curve is the mirror image (flipped horizontally).
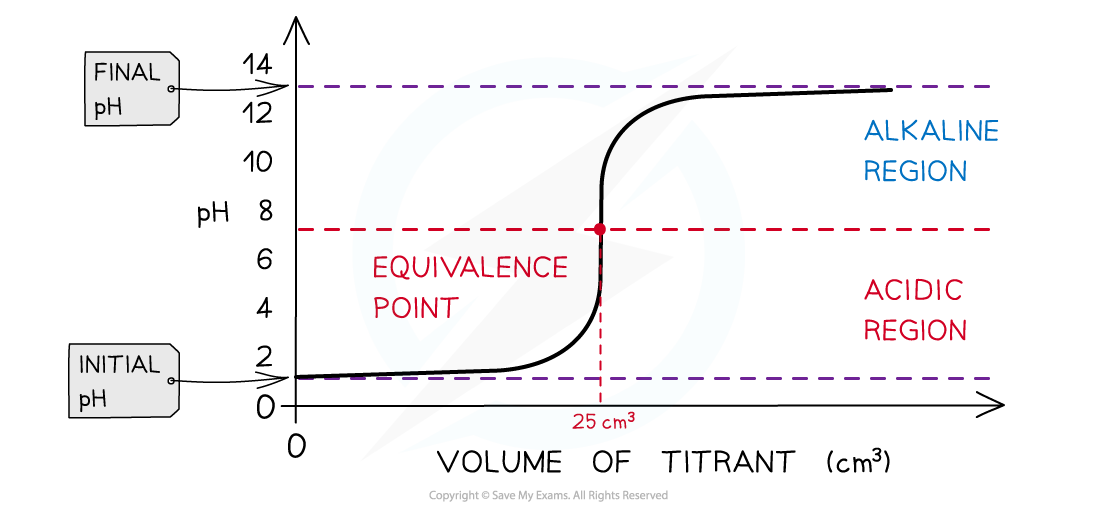
Strong Acid + Strong Alkali
Example:
The Process:
-
The Start (Acid Only):
- The flask contains only strong acid (
). - Since
is fully dissociated, is high. - Initial pH: Starts very low (
pH 1 for ).
- The flask contains only strong acid (
-
The Approach (Adding Alkali):
- As
is added, reacts with : . - The pH rises very slowly at first.
- Why? The concentration of
is decreasing, but because pH is logarithmic ( ), a large change in concentration is needed to shift the pH number significantly.
- As
-
The Vertical Section (The Surge):
- As the moles of alkali approach the moles of acid, the remaining
becomes tiny. - Adding just one more drop of
causes a massive proportional change in . - The pH shoots vertically from pH 3 to pH 10.
- As the moles of alkali approach the moles of acid, the remaining
-
The Equivalence Point:
- This is the midpoint of the vertical section.
- At this exact volume, moles of acid = moles of alkali.
- The solution contains only Water and Salt (
). - Since
is neutral, the Equivalence pH is exactly 7.0.
-
The Excess (Alkali Only):
- Beyond the equivalence point, there is no
left to react. - The beaker now accumulates excess
ions from the strong base. - The pH levels off (asymptotes) at the pH of the strong alkali.
- Final pH: High (
pH 13-14).
- Beyond the equivalence point, there is no
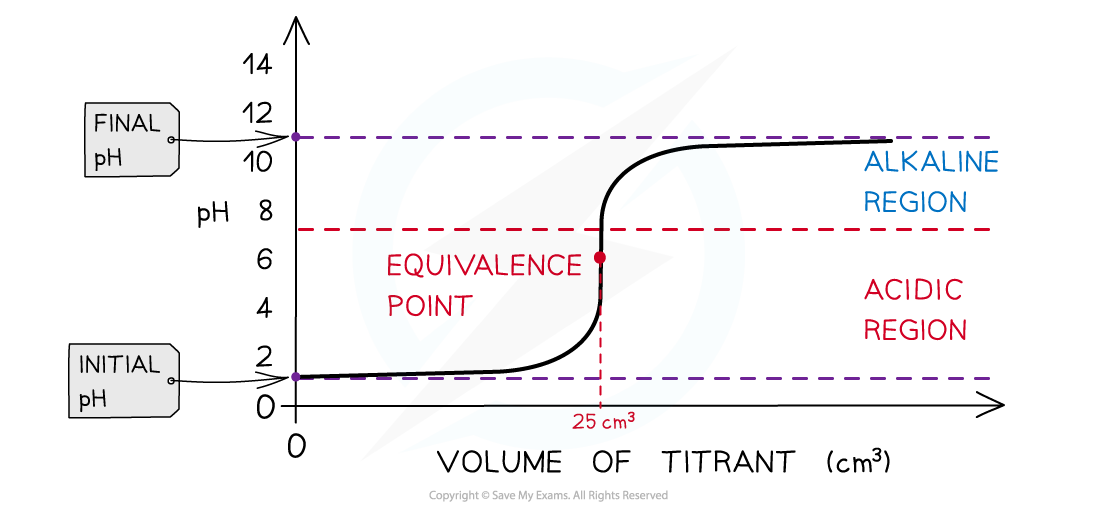
Strong Acid + Weak Alkali
The Process:
-
The Start (Acid Only):
- The flask contains only strong acid (
). - Initial pH: Very low (approx pH 1), identical to the Strong/Strong curve.
- The flask contains only strong acid (
-
The Approach:
- As Weak Alkali (
) is added, it reacts with : - The pH rises slowly.
- As Weak Alkali (
-
The Vertical Section:
- The sharp rise in pH is shorter than in a Strong/Strong titration.
- Typical Jump: pH 3 to pH 7.
-
The Equivalence Point (The Key Difference):
- The midpoint occurs below pH 7 (approx pH 5).
- Why? At equivalence, the solution contains only the salt Ammonium Chloride (
). - The Ammonium ion (
) is the conjugate acid of a weak base. It reacts with water (hydrolysis) to release protons: - This release of
makes the final salt solution acidic.
-
The Excess (Weak Alkali):
- Beyond equivalence, excess
accumulates. - Since
is a weak base (partially dissociated), it produces fewer ions than NaOH. - Final pH: Levels off at a lower value (approx pH 11).
- Beyond equivalence, excess
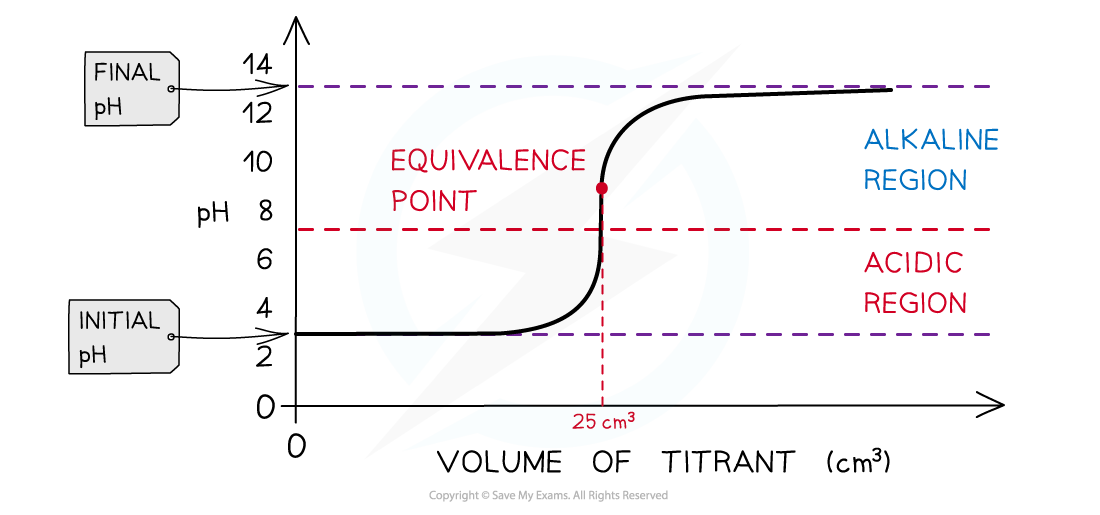
Weak Acid + Strong Alkali
The Process:
-
The Start (Acid Only):
- The flask contains only weak acid (
). - Since it only partially dissociates, the
is low. - Initial pH: Higher than a strong acid (approx pH 3).
- The flask contains only weak acid (
-
The “Buffer Region” (The unique flat part):
- Unlike the Strong Acid curve, the pH rises steeply at first, then flattens out into a shallow slope.
- Why? You are creating a Buffer Solution.
- As you add
, you convert some Acid ( ) into its Salt ( ). - The flask now contains a mixture of a Weak Acid and its Conjugate Base.
- This mixture actively resists changes in pH, keeping the line relatively flat until the acid is nearly used up.
-
The Vertical Section:
- As the acid is exhausted, the buffering action fails.
- The pH rises sharply, but the vertical section is shorter than for a strong acid.
- Typical Jump: pH 7 to pH 11.
-
The Equivalence Point (The Key Difference):
- The midpoint occurs above pH 7 (approx pH 9).
- Why? At equivalence, the solution contains only the salt Sodium Ethanoate (
). - The Ethanoate ion (
) is the conjugate base of a weak acid. It reacts with water (hydrolysis): - This production of
ions makes the final salt solution alkaline.
-
The Excess (Strong Alkali):
- Beyond equivalence, excess
from the accumulates. - The curve follows the same path as the Strong Acid/Strong Alkali titration.
- Final pH: High (approx pH 13-14).
- Beyond equivalence, excess
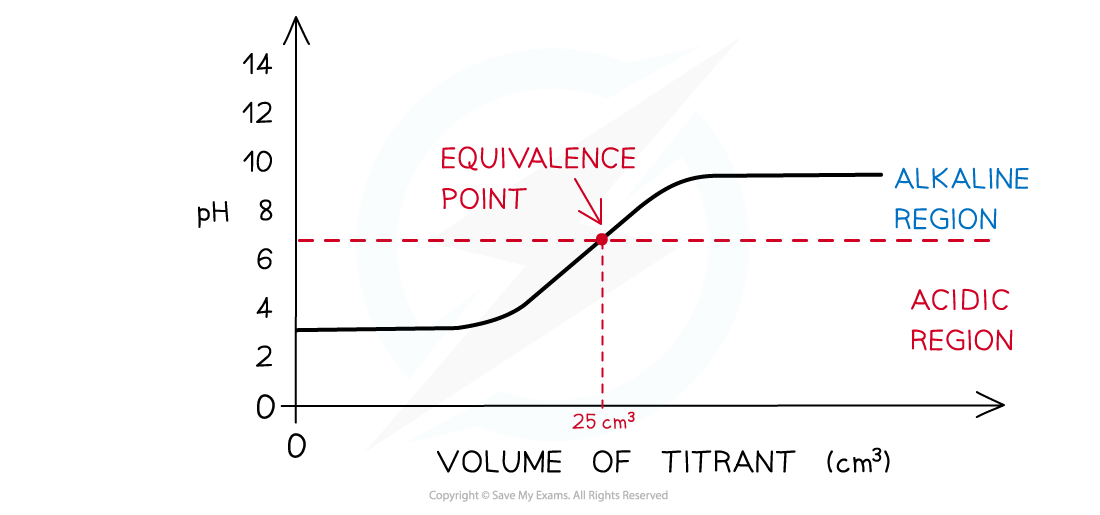
Weak Acid + Weak Alkali
The Process:
-
The Start (Weak Acid):
- The flask contains only weak acid (
). - Initial pH: Approx pH 3 (Partial dissociation).
- The flask contains only weak acid (
-
The Shape (The Problem):
- The graph shows a gradual, continuous rise in pH from start to finish.
- There is NO Vertical Section.
- Why? This is a “double buffer” situation.
- Before equivalence, the mixture (
) acts as an acidic buffer, resisting pH rise. - After equivalence, the excess weak base (
) acts as a basic buffer, resisting pH rise.
- Before equivalence, the mixture (
- The result is a sluggish curve that never jumps sharply.
-
The Equivalence Point:
- There is no steep jump, only a subtle “Point of Inflexion” (a slight wiggle in the line).
- It occurs approximately at pH 7.
- Why pH 7? The salt formed is Ammonium Ethanoate. The acidity of the cation (
) roughly cancels out the alkalinity of the anion ( ), resulting in a roughly neutral solution.
-
The End (Weak Alkali):
- The graph flattens out at the pH of the weak alkali.
- Final pH: Approx pH 11.
-
Practical Consequence (Crucial for Exams):
- A standard titration cannot be performed for this combination.
- Since there is no vertical section, there is no sharp change in pH.
- No chemical indicator is suitable (no indicator will give a sharp colour change).
- A pH meter would be required to detect the point of inflexion.
Why Standard Titration Fails
For a Weak Acid + Weak Alkali reaction, a standard titration using a visual indicator is impossible.
- The Problem: The pH curve has no vertical section. The pH changes gradually throughout the entire reaction.
- The Consequence: There is no “sharp” change in pH. No chemical indicator can undergo a distinct color change at the endpoint; the color would change slowly and gradually over a large volume range, making precise measurement impossible.
Solution: Thermometric Titration
Since pH is unreliable for this combination, we measure Temperature instead.
- The Principle: Neutralization is an exothermic reaction.
- The Method:
- As alkali is added, the temperature RISES continuously.
- At the equivalence point, the reaction stops, so heat production stops.
- Adding excess alkali causes the temperature to FALL (due to dilution/cooling).
- The Result: Plotting Temperature vs Volume gives two lines intersecting at a peak. This peak volume is the precise endpoint.
Alternative: Using a pH Meter
While indicators fail, a pH Meter can still be used to determine the endpoint for a Weak Acid + Weak Base titration.
- Method: A data logger records the pH continuously as the alkali is added.
- Analysis: The data is plotted as a graph (pH vs Volume). Although there is no vertical jump, there is a Point of Inflexion (a specific point where the curvature changes direction).
- Calculus: Mathematically, this corresponds to the maximum value of the first derivative (
), allowing the endpoint to be identified computationally.